Sub navigation menu:
You are here: You are here > Products > Global X Hang Seng Index Daily (2x) Leveraged Product > FAQ
 Global X Hang Seng Index Daily (2x) Leveraged Product (Stock Code: 7231)
| Questions |
|---|
| 1. What are Leveraged Products? |
| Leveraged Products typically aim to deliver a daily return equivalent to a multiple of the underlying index return. For example, if the underlying index rises by 10 per cent on a given day, two times (2x) the Leveraged Product should deliver a 20 per cent return on that day. |
| 2. What are the differences between the Index and the leveraged performance of the Index for a period longer than one day (i.e. comparison of the point-to-point performance)? |
The Product’s objective is to provide return which is of a predetermined leverage factor (2x) of the Daily performance of the Index. As such, the Product’s performance may not track twice the cumulative Index return over a period greater than 1 Business Day. This means that the return of the Index over a period of time greater than a single day multiplied by 200% generally will not equal the Product’s performance over that same period.
Scenario I: Continuous upward trend
In a continuous upward trend, where the Index rises steadily for more than 1 Business Day, the Product’s accumulated return will be greater than twice the cumulative Index gain. As illustrated in the scenario below, where an investor has invested in the Product on day 0 and the Index grows by 10% daily for 4 Business Days, by day 4 the Product would have an accumulated gain of 107%, compared with a 93% gain which is twice the cumulative Index return.
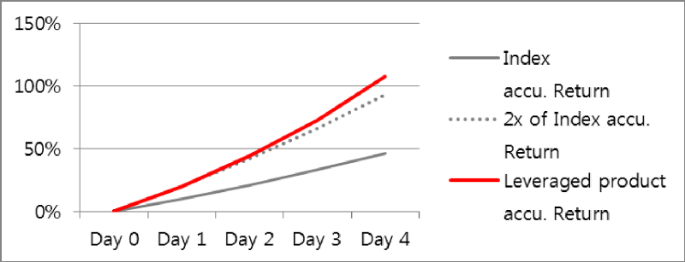
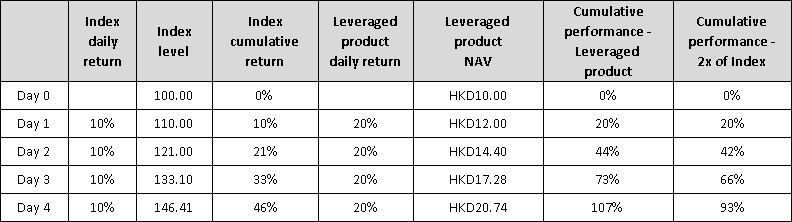 The chart below further illustrates the difference between the Product’s performance versus twice the cumulative Index return in a continuous upward market trend over a period greater than 1 Business Day.
 Scenario II: Continuous downward trend
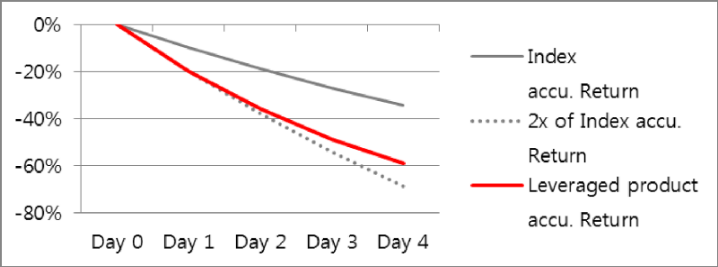
In a continuous downward trend, where the Index falls steadily for more than 1 Business Day, the Product’s accumulated loss will be less than twice the cumulative Index loss. As illustrated in the scenario below, where an investor has invested in the Product on day 0 and the Index falls by 10% daily for 4 Business Days, by day 4 the Product would have an accumulated loss of 59%, compared with a 69% loss which is twice the cumulative Index return. 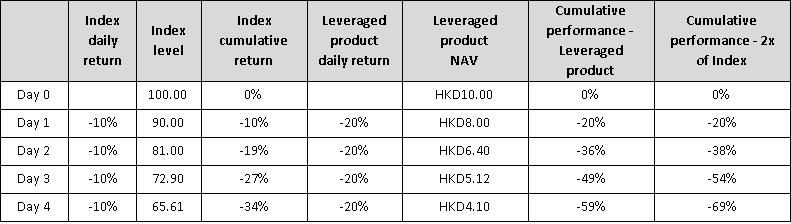 The chart below further illustrates the difference between the Product’s performance versus twice the cumulative Index return in a continuous downward market trend over a period greater than 1 Business Day.
 Scenario III: Volatile upward trend
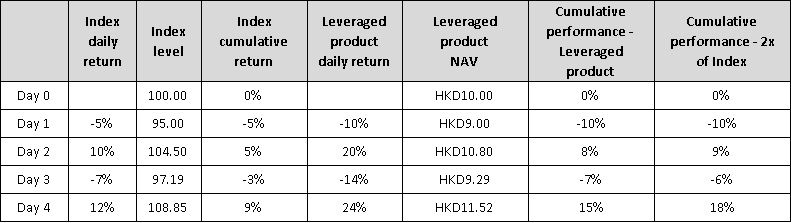
In a volatile upward trend, where the Index generally moves upward over a period longer than 1 Business Day but with intraday volatility, the Product’s performance may be adversely affected in that the Product’s performance may fall short of twice the cumulative Index return. As illustrated in the scenario below, where the Index grows by 9% over 5 Business Days but with intraday volatility, the Product would have an accumulated gain of 15%, compared with a 18% gain which is twice the cumulative Index return.
Scenario III: Volatile upward trend
In a volatile upward trend, where the Index generally moves upward over a period longer than 1 Business Day but with intraday volatility, the Product’s performance may be adversely affected in that the Product’s performance may fall short of twice the cumulative Index return. As illustrated in the scenario below, where the Index grows by 9% over 5 Business Days but with intraday volatility, the Product would have an accumulated gain of 15%, compared with a 18% gain which is twice the cumulative Index return.
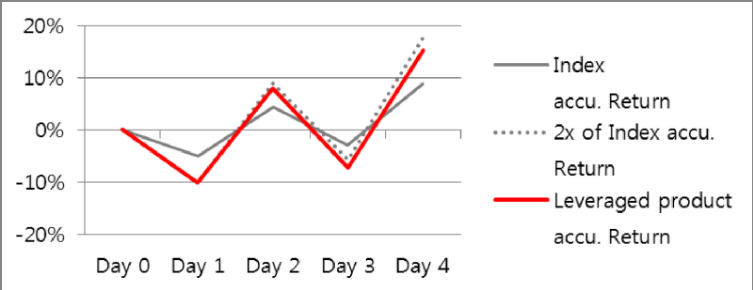
 The chart below further illustrates the difference between the Product’s performance versus twice the Index accumulated return in a volatile upward market trend over a period greater than 1 Business Day.
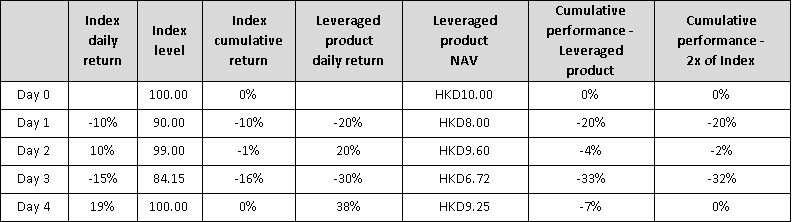
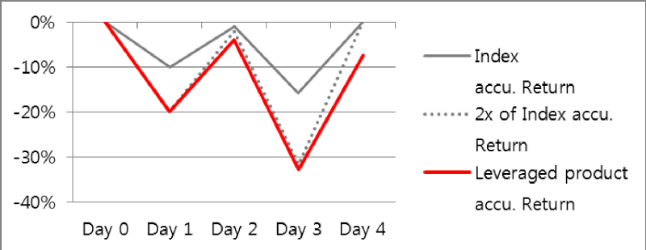
 Scenario IV: Volatile downward trend
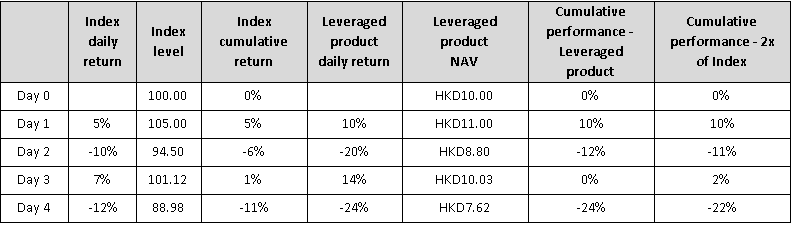
In a volatile downward trend, where the Index generally moves downward over a period longer than 1 Business Day but with intraday volatility, the Product’s performance may be adversely affected in that the Product’s performance may fall short of twice the cumulative Index return. As illustrated in the scenario below, where the Index falls by 11% over 5 Business Days but with intraday volatility, the Product would have an accumulated loss of 24%, compared with a 22% loss which is twice the cumulative Index return.
Scenario IV: Volatile downward trend
In a volatile downward trend, where the Index generally moves downward over a period longer than 1 Business Day but with intraday volatility, the Product’s performance may be adversely affected in that the Product’s performance may fall short of twice the cumulative Index return. As illustrated in the scenario below, where the Index falls by 11% over 5 Business Days but with intraday volatility, the Product would have an accumulated loss of 24%, compared with a 22% loss which is twice the cumulative Index return.
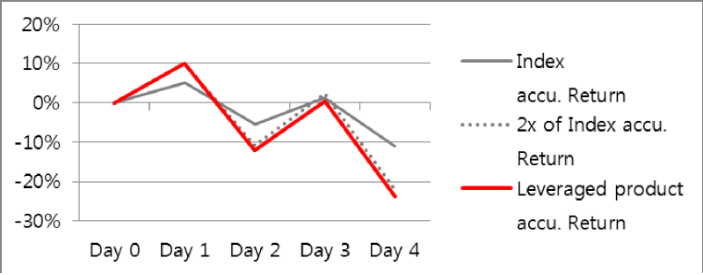
 The chart below further illustrates the difference between the Product’s performance versus twice the cumulative Index return in a volatile downward market trend over a period greater than 1 Business Day.
 Scenario V: Volatile market with flat index performance
In a volatile market with flat index performance, the aforementioned compounding can have an adverse effect on the performance of the Product. As illustrated below, even if the Index has returned to its previous level, the Product may lose value.
Scenario V: Volatile market with flat index performance
In a volatile market with flat index performance, the aforementioned compounding can have an adverse effect on the performance of the Product. As illustrated below, even if the Index has returned to its previous level, the Product may lose value.
 The chart below further illustrates the difference between the Product’s performance versus twice the cumulative Index return in a volatile market with flat index performance over a period greater than 1 Business Day.
 As illustrated in the graphs and the tables, the cumulative performance of the Product is not equal to twice the cumulative performance of the Index over a period longer than 1 Business Day.
Investors should note that due to the effect of “path dependency” and compounding of the Daily returns of the Index, the performance of the Index multiplied by two (and as a result the performance of the Product before deduction of fees and expenses) for periods longer than a single day, especially in periods of market volatility which has a negative impact on the cumulative return of the Product, may not be twice the return of the Index and may be completely uncorrelated to the extent of change of the Index over the same period
As illustrated in the graphs and the tables, the cumulative performance of the Product is not equal to twice the cumulative performance of the Index over a period longer than 1 Business Day.
Investors should note that due to the effect of “path dependency” and compounding of the Daily returns of the Index, the performance of the Index multiplied by two (and as a result the performance of the Product before deduction of fees and expenses) for periods longer than a single day, especially in periods of market volatility which has a negative impact on the cumulative return of the Product, may not be twice the return of the Index and may be completely uncorrelated to the extent of change of the Index over the same period
|
| 3. What is "Path Dependency"? |
The Product aims to track two times the performance of the Index on a Daily basis. However, due to path dependency of the Index and twice the Daily performance of the Index, when comparing the Index and two times the performance of the Index for a period longer than one day (i.e. comparison of the point-to-point performance), the historical two times performance of the Index will not be equal to the simple two times performance of the Index over the same period of time.
Below is an example which illustrates the “path dependency” of the Index and two times the performance of the Index. Please note that figures used are for illustration purposes only and are not indicative of the actual return likely to be achieved.
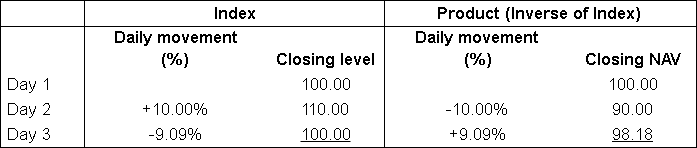 Assuming the Product tracks twice the performance of the Index perfectly on a Daily basis, the absolute percentage change in the Daily movement of the Product will be twice of the Index. That is, the Net Asset Value of the Product will rise by 20.00% if the Index rises by 10.00%, and the Net Asset Value of the Product will fall by 18.18% if the Index falls by 9.09%. On the basis of such Daily movements, the respective closing levels of the Index and closing Net Asset Values of the Product are as set out in the example above.
On day 3, the closing level of the Index is 100 which is the same as its closing level on day 1 but the closing Net Asset Value of the Product is 98.18 which is lower than its closing Net Asset Value on day 1. Hence, when comparing the performance of the Index and the performance of the Product from day 1 to day 3, it is clear that the performance of the Product is not a simple performance of the Index multiplied by two.
Assuming the Product tracks twice the performance of the Index perfectly on a Daily basis, the absolute percentage change in the Daily movement of the Product will be twice of the Index. That is, the Net Asset Value of the Product will rise by 20.00% if the Index rises by 10.00%, and the Net Asset Value of the Product will fall by 18.18% if the Index falls by 9.09%. On the basis of such Daily movements, the respective closing levels of the Index and closing Net Asset Values of the Product are as set out in the example above.
On day 3, the closing level of the Index is 100 which is the same as its closing level on day 1 but the closing Net Asset Value of the Product is 98.18 which is lower than its closing Net Asset Value on day 1. Hence, when comparing the performance of the Index and the performance of the Product from day 1 to day 3, it is clear that the performance of the Product is not a simple performance of the Index multiplied by two.
|
| 4. What are the differences between buying futures and buying Leveraged Products? |
| The maximum potential loss when buying Leveraged Products is the entire value of the initial investment. However, the maximum potential loss when investors trade futures could be greater than the initial collateral posted which would result in additional margin calls. |
| 5. What are the differences between futures-based and swap-based structure? |
Both futures-based replication and swap-based synthetic replication structures are allowed for Leveraged Products subject to SFC authorisation.
Swap and futures contracts have the same function: both allow investors to buy or sell a specific type of asset at a specific time at a given price. However, there are also some differences as illustrated in the table below:
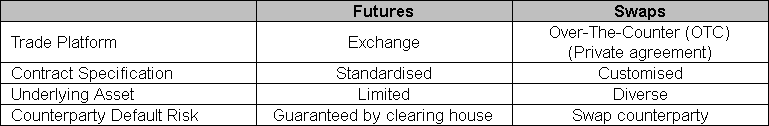 Because of the above differences, futures-based replication and swap-based synthetic replication structures have distinct features. In terms of portfolio composition, futures-based replication tends to be more transparent. In terms of diversity of underlying assets and investment strategies, swap-based synthetic replication provides more flexibility. In terms of counterparty default risk, future-based replication faces lower risk in general as futures contracts are guaranteed by clearing houses.
|
| 6. What are the differences between Leveraged Products, traditional ETFs, derivative warrants and Callable Bull/Bear Contracts (CBBCs)? |
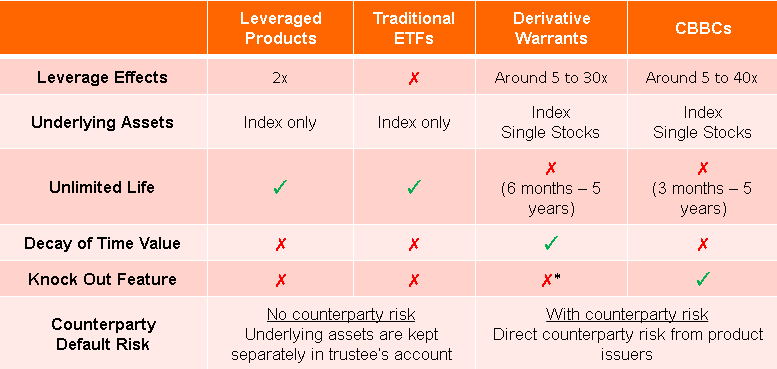 * Exclude exotic warrants with knock out features
|
- [1]
- If you cannot view the documents, you will need to install Adobe Reader®. Click here to download Adobe Reader®.
Disclaimer:
- Certain information contained in this website is compiled from third party sources. Mirae Asset Global Investments (Hong Kong) Limited (“Mirae Asset HK”) has used its best endeavor to ensure that such information is accurate, complete and up-to-date, and has taken care in accurately reproducing the information. Mirae Asset HK accepts no liability for any loss or damage of any kind resulting out of the unauthorized use of this website. The information contained in this website is for information purposes only and does not constitute any recommendation, offer or solicitation to buy, sell or subscribe to any securities or financial instruments in any jurisdiction. Investment involves risk. It cannot be guaranteed that the performance of the Product will generate a return and there may be circumstances where no return is generated or the amount invested is lost. Past performance is not indicative of future performance. Before making any investment decision to invest in the Product, investors should read the Product’s prospectus for details and the risk factors. Investors should ensure they fully understand the risks associated with the Product and should also consider their own investment objective and risk tolerance level. Investors are advised to seek independent professional advice before making any investments. The Product’s prospectus is available on this website.
- References to particular sectors, securities or companies are for general information and illustrative purposes only and are not recommendations to buy or sell a security, or an indication of the issuer's holdings at any one time.
- The funds or securities referred to herein are not sponsored, endorsed, or promoted by Hang Seng Index ("HSI"), and HSI bears no liability with respect to any such funds or securities or any index on which such funds or securities are based. The Product’s prospectus contains a more detailed description of the limited relationship HSI has with Mirae Asset HK and any related funds.
- Investors should note that the Product differs from a typical retail fund as units of the Product may only be created and realized by participating dealers in large unit sizes. This website is prepared and maintained by Mirae Asset HK and has not been reviewed by the Securities and Futures Commission of Hong Kong.