Sub navigation menu:
 Global X S&P Crude Oil Futures Enhanced ER ETF
FAQ
| Questions |
| 1. What is the structure of Mirae Asset Horizons S&P Crude Oil Futures Enhanced ER ETF? |
| Mirae Asset Horizons S&P Crude Oil Futures Enhanced ER ETF(“Fund”) tracks the performance of the S&P GSCI Crude Oil Enhanced Index Excess Return (“Index”) (“Excess Return” does not mean any additional return on the Fund’s performance). The Index tracks the price of the West Texas Intermediate crude oil (also known as Texas light sweet crude oil) Futures Contracts with different expiration dates traded on the New York Merchantile Exchange (“NYMEX”) (the “WTI Futures Contracts”), which is an exchange of the Chicago Mercantile Exchange Group Inc. (“SME Group”).
|
|
2. What is WTI crude oil?
|
|
West Texas Intermediate (“WTI”) crude oil, also known as Texas light sweet, is a grade of crude oil used as a benchmark in oil pricing. WTI consists of a blend of several U.S. domestic streams of light sweet crude oil. As a pricing mechanism for physical delivery of crude oil in North America, WTI is firmly rooted in the physical market. Because of the unique immediacy, breadth, and depth of pricing and inventory data supplied by the U.S. government, and because onshore North American production has been a key driver of growing global crude oil supply over the past decade, WTI is widely regarded as the crude oil benchmark that reflects the supply and demand dynamics of the market.
This grade is described as light because of its relatively low density, and sweet because of its low sulphur content. Due to its high viscosity and low sulphur content, WTI crude oil can produce a high yield of gasoline during the refining process. WTI crude oil is the underlying commodity of the WTI Futures Contracts.
|
|
3. What are WTI Futures Contracts?
|
|
WTI Futures Contracts are standardized contracts where the parties agree to exchange WTI crude oil at a future date at a pre-determined price. They are traded on the NYMEX in USD. The parent company of NYMEX is CME Group Inc., which is an American futures company and one of the largest futures and options exchanges. It comprises four exchanges, namely Chicago Mercantile Exchange (“CME”), Chicago Board of Trade (“CBOT”), NYMEX and Commodity Exchange Inc. (“COMEX”). WTI Futures Contract is one of the deepest and most liquid global energy benchmarks, trading nearly 850,000 futures and options contracts daily. The open interest of WTI Futures Contracts exceeds 3 million lots, equivalent to more than 3 billion barrels.
For many commodities (e.g. oil, agricultural products), it is not possible to physically access and store the underlying commodity for long periods. Therefore, investors prefer to invest in liquid and easy to trade investment vehicle, including crude oil futures.
|
|
4. What price is tracked by Mirae Asset Horizons S&P Crude Oil Futures Enhanced ER ETF?
|
Further to the impossibility for many commodities (e.g., oil, agricultural products)to be physically accessed and stored for long periods, futures pricing can be more efficient for some commodities, especially where the futures contracts helps to standardize the pricing (e.g, agricultural commodities where quality varies between crops, seasons and regions).
Therefore, the Fund is priced off futures contracts.
An investment in an ETF that tracks crude oil futures is not the same as investing in the spot price of the crude oil itself.
It is important to note that while investment returns of crude oil futures will vary from the spot return, the correlation will typically be very high. For example, as shown below, the daily correlation between the Index, the futures based index tracked by the Fund and the spot price of oil (WTI spot price) has been 0.9132 over the last 10 years.
<30-Day Daily Correlation of S&P GSCI Crude Oil Enhanced Index Excess Return vs. WTI Spot>
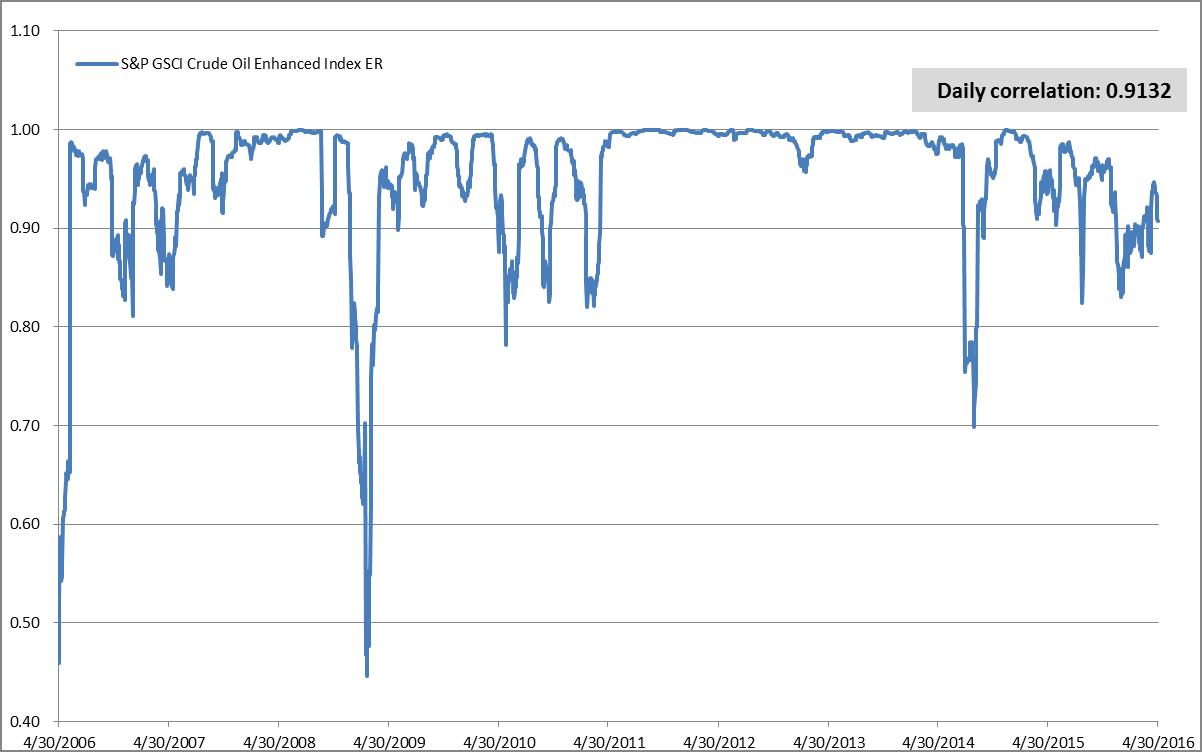 * Source: Bloomberg, Past performance is not an indicator of future performance.
For further details about the Index, please refer to page 50 of the prospectus.
* Source: Bloomberg, Past performance is not an indicator of future performance.
For further details about the Index, please refer to page 50 of the prospectus.
|
|
5.What is ‘futures roll’, contango and backwardation?
|
Very often, investors in crude oil futures do not wish to take delivery of the crude oil itself. Instead, investors usually trade their futures contracts before expiry and replace them with contracts with a later expiry. This process is known as “rolling”. Understanding rolling is important for crude oil investors as it impacts investment returns.
As an example, the new futures contract that investors ‘roll’ into may refer to a higher future price, which would mean that the investor receives fewer new contracts for the same investment amount. Assuming the commodity price does not rise, the rolling will result in a loss. This phenomenon is known as “contango”.
The opposite scenario can also occur, where the new futures contract an investor ‘rolls’ into may refer to a lower price. Assuming then that the commodity price does not change at the time of the expiry, the investor will profit. This is known as “backwardation”.
The below figure depicts these two scenarios, using the examples of a crude oil futures contract. The blue line (with negative slope) is the crude oil futures curve in backwardation. In backwardation, investors ‘roll’ into lower future price, producing positive roll yields. On the other hand, the red line (with positive slope) is the crude oil futures curve in contango. In contango, investors ‘roll’ into higher future price, producing negative roll yields.
<Crude oil futures Curve in contango and backwardation>
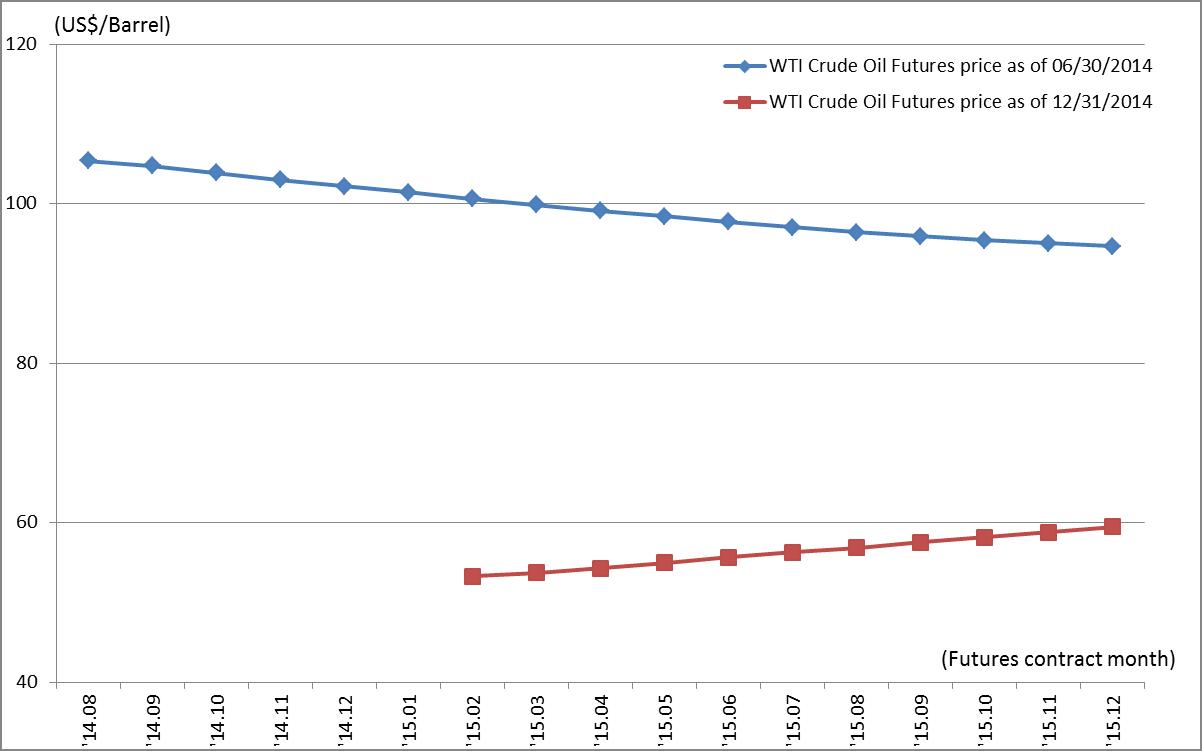 * Source: Bloomberg
|
|
6. What is the effect of roll-over on the index and the ETF price?
|
A roll yield is the amount of return generated in a backwardated futures market that is achieved by rolling a short-term contract into a longer-term contract and profiting from the convergence towards a higher spot price.
This example shows the effect of roll yield in contango:
- Day 0: the ETF enters into the nearest futures contract at the level of 100
- 1 month later from Day 0: the ETF closes out the position by selling the nearest futures contract at 110 then enters into the next nearest futures contract at 117, i.e. the ETF has a negative roll yield of -7 from this rollover trade
- 2 months later from Day 0: the ETF closes out the position of selling the next nearest futures contract at 120.
- Calculate the profit from Day 0: When we calculate the profit of the ETF, we must count negative rollover yield, -7. Therefore, the profit of the ETF is 120 - 100 - 7, which is 13.
| |
Day 0 |
1 month later (rollover trade) |
2 months later |
| nearest futures |
100 |
110 |
|
| next nearest futures |
105 |
117 |
120 |
[As illustrated in the previous example, as long as an investor holds the crude oil ETF for 2 months, the roll-over effects will take place.]
|
|
7. Is it possible for ETFs based on futures contracts to outperform the commodity spot prices?
|
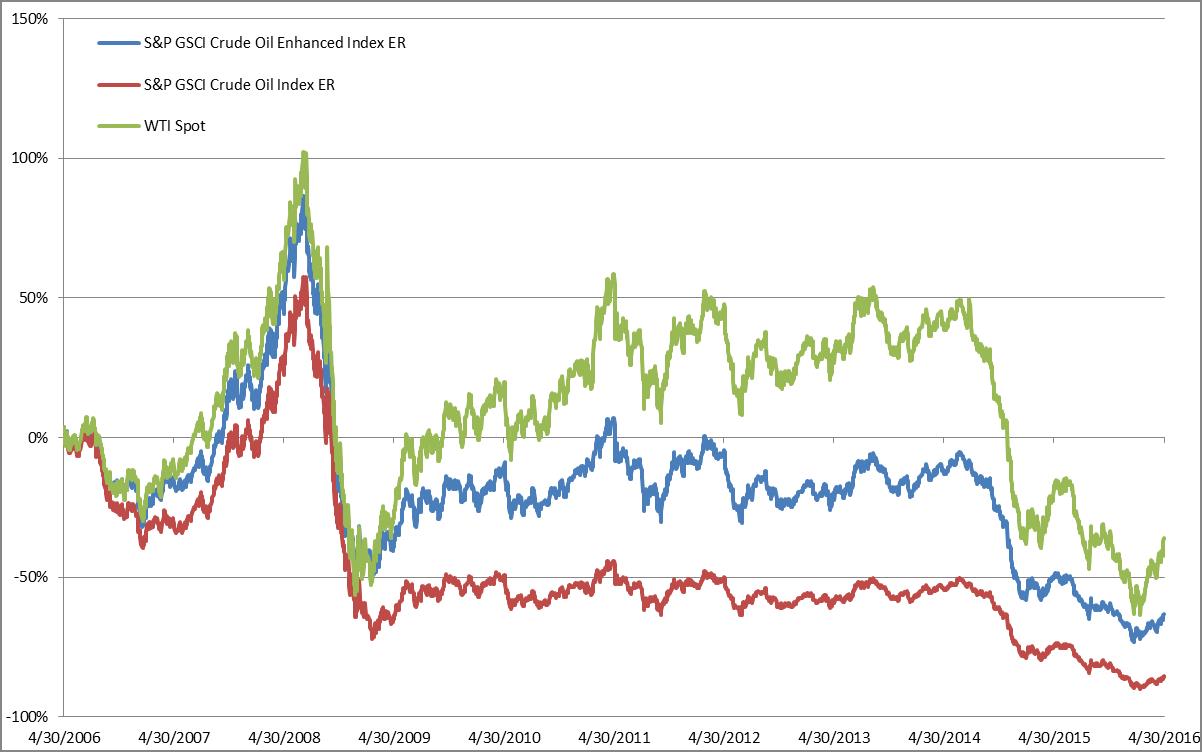
Yes, it is. When the futures contracts are in ‘backwardation’, the ‘roll yield’ will be positive which would lead to outperformance compared to the commodity ‘spot price’. For example, the following table depicts the performance of the Index (an index based on oil futures contracts) in 2014. As the below indicates, the Index outperformed the spot price of oil in 2014 as the oil futures contracts were in backwardation for extended periods during that period.
<Annual performance of S&P GSCI Crude Oil Enhanced Index Excess Return vs. WTI Spot>
| |
2016(YTD) |
2015 |
2014 |
2013 |
2012 |
2011 |
2010 |
| S&P GSCI Crude Oil Enhanced Index ER |
10.0% |
-31.7% |
-42.3% |
6.3% |
-12.6% |
2.6% |
7.4% |
| WTI Spot |
24.0% |
-30.5% |
-45.9% |
7.2% |
-7.1% |
8.2% |
15.1% |
* As of 30 Apr 2016
* Source: Bloomberg
|
|
8. Is there any way to avoid the effects of rolling?
|
|
For certain commodities, and to access diversified baskets of commodities, the only way for investors to get investment exposure is via futures contracts (and via indices based on these contracts). Rolling futures are a necessary part of investing in these commodities and cannot be avoided.
|
|
9. What is the difference between S&P GSCI Crude Oil “Enhanced” Index and conventional indexes?
|
Most conventional indexes (S&P GSCI Index and Bloomberg Commodity Index) implement a rigid front and second month only roll process. In an index that uses a front-month roll process, the index will roll to the next available contract.
In an effort to alleviate the negative effects when a market is in contango (that is, when the next-to-expire contract is trading at a lower price than contracts expiring in later months), the Index changes the standard rolling rules for the WTI Crude Oil included in the S&P GSCI Index. Thus, when a market is in contango, the Index follows a rule-based dynamic rollover rules that seeks to reduce the negative effects of rolling futures contracts.
On the other hand, when a market is in backwardation(that is, when the next-to-expire contract is trading at a lower price than contracts expiring in later months), the Index simply follows standard rollover rules for the WTI Crude Oil included in the S&P GSCI Index.
For a step-by-step example of how the Index’s rolling process works, see page 77 of the Prospectus.
<Annual performance of S&P GSCI Crude Oil Enhanced Index Excess Return vs. WTI Spot>
| |
1 mo |
3 mo |
6 mo |
YTD |
1Y |
3Y |
5Y |
10Y |
| S&P GSCI Crude Oil Enhanced Index ER |
12.1% |
15.5% |
-7.6% |
10.0% |
-27.9% |
-54.0% |
-65.8% |
-63.4% |
| S&P GSCI Crude Oil Index ER |
16.0% |
17.8% |
-23.3% |
3.5% |
-44.2% |
-65.6% |
-74.3% |
-85.6% |
| WTI Spot |
19.8% |
36.6% |
-1.4% |
24.0% |
-23.0% |
-50.9% |
-59.7% |
-36.1% |
| |
2016(YTD) |
2015 |
2014 |
2013 |
2012 |
2011 |
2010 |
2009 |
2008 |
2007 |
| S&P GSCI Crude Oil Enhanced Index ER |
10.0% |
-31.7% |
-42.3% |
6.3% |
-12.6% |
2.6% |
7.4% |
31.7% |
-48.4% |
48.5% |
| S&P GSCI Crude Oil Index ER |
3.5% |
-45.4% |
-42.6% |
6.0% |
-11.6% |
-1.4% |
-0.2% |
-7.0% |
-56.1% |
-40.9% |
| WTI Spot |
24.0% |
-30.5% |
-45.9% |
7.2% |
-7.1% |
8.2% |
15.1% |
77.9% |
-53.5% |
57.2% |
* As of 30 Apr 2016
* Source: Bloomberg
|
|
10. Overview about Crude Oil
|
What is crude oil?
Crude oil is a naturally occurring, unrefined petroleum product composed of hydrocarbon deposits and other organic materials. Crude oil can be refined to produce usable products such as gasoline, diesel and various forms of petrochemicals. It is a non-renewable resource, also known as fossil fuel, which means that it cannot be replaced naturally at the rate people consume it and is therefore a limited resource.
Crude oil supply
Crude oil production by the Organization of the Petroleum Exporting Countries (“OPEC”) is an important factor that affects oil prices. This organization seeks to actively manage oil production in its member countries by setting production targets. Historically, crude oil prices have seen increases in times when OPEC production targets are reduced.
OPEC member countries produce about 30% of the world’s crude oil. Equally important to global prices, OPEC’s oil exports represent about 60% of the total petroleum traded internationally. Because of this market share, OPEC’s actions can, and do, influence international oil prices. In particular, indications of changes in crude oil production from Saudi Arabia, OPEC's largest producer, frequently affect oil prices.
The extent to which OPEC member countries utilize their available production capacity is often used as an indicator of the tightness of global oil markets, as well as an indicator of the extent to which OPEC is exerting upward influence on prices. OPEC spare capacity provides an indicator of the world oil market's ability to respond to potential crisis that reduce oil supplies. As a result, oil prices tend to incorporate a rising risk premium when OPEC spare capacity reaches low levels. Markets are influenced by geopolitical events within and between OPEC countries because they have, historically, resulted in reductions in oil production. Given OPEC's market significance, events that entail an actual or future potential loss of oil supplies can produce strong reactions in oil prices.
Oil production from countries outside the OPEC currently represents about 70% of world oil production. Key centers of non-OPEC production include North America, regions of the former Soviet Union and the North Sea.
In contrast to OPEC oil production, which is subject to central coordination, non-OPEC producers make independent decisions about oil production. Also, in contrast to OPEC, where oil production is mostly in the hands of national oil companies (“NOCs”), international or investor-owned oil companies (“IOCs”) perform most of the production activities in non-OPEC countries. IOCs seek primarily to increase shareholder value and make investment decisions based on economic factors. While some NOCs operate in a similar manner as IOCs, many have additional objectives such as providing employment, infrastructure or revenue that impact their country in a broader sense. As a result, non-OPEC investment and thus future supply capability, tends to respond more readily to changes strictly in market conditions.
Producers in non-OPEC countries are generally regarded as price takers, that is, they respond to market prices rather than attempt to influence prices by managing production. As a result, non-OPEC producers tend to produce at or near full capacity and so have little spare capacity.
Crude oil demand
OECD consists of the United States, much of Europe, and other advanced countries. At 53% of world oil consumption in 2010, these large economies consume more oil than the non-OECD countries, but oil consumption in the OECD countries has declined since 2001 and was at 49% of world oil consumption in 2014, whereas non-OECD consumption rose 38% during the same period.
Structural conditions in each country's economy influence the relationships among oil prices, economic growth and oil consumption. Developed countries tend to have higher vehicle ownership per capita. Because of this, oil use within the OECD transportation sector usually accounts for a larger share of total oil consumption than in non-OECD countries. It is also more mature and slower-growing. Economic conditions and policies that affect the transport of goods and people thus have a significant impact on total oil consumption in OECD countries. Many OECD countries have higher fuel taxes and policies to improve the fuel economy of new vehicles and increase the use of biofuels. This tends to slow the growth in oil consumption even in times of strong economic growth. Furthermore, the economies in OECD countries tend to have larger service sectors relative to manufacturing. As a result, strong economic growth in these countries may not have the same impact on oil consumption as it would in non-OECD countries.
OECD countries tend to have fewer subsidies on end-use prices, so changes in market oil prices are often quickly reflected in prices faced by consumers. However, it takes time for people to adjust their transportation routines and for the vehicle stock to turn over and become more energy-efficient in response to price changes.
Changes in expected future oil prices also affect consumers’ decisions concerning modes of transportation and vehicle purchases. If prices are expected to remain high or increase in the future, more consumers may decide to purchase more fuel efficient vehicles or use public transportation. Decisions like these help to reduce future oil demand and would tend to moderate expected price increases.
Oil consumption in developing countries that are not part of the OECD has risen sharply in recent years. While oil consumption in the OECD countries declined from 63% in 2010 to 49% in 2014, non-OECD oil consumption increased from 37% in 2010 to 51% in 2014. China, India, and Saudi Arabia had the largest growth in oil consumption among the countries in the non-OECD during this period.
Rising oil consumption reflects rapid economic growth in these countries. Current and expected levels of economic growth heavily influence global oil demand and oil prices. Commercial and personal transportation activities, in particular, require large amounts of oil and are directly tied to economic conditions. Many manufacturing processes consume oil as fuel or use it as feedstock, and in some non-OECD countries, oil remains an important fuel for power generation. Because of these uses, oil prices tend to rise when economic activity and in turn oil demand is growing strongly. Many non-OECD countries are also experiencing rapid growth in population, which is an additional factor supporting strong oil consumption growth.
Structural conditions in each country’s economy further influence the relationship between oil prices and economic growth. Developing countries tend to have a greater proportion of their economies in manufacturing industries, which are more energy intensive than service industries. Although transportation oil use is usually a smaller share of total oil consumption in non-OECD countries, this use tends to increase rapidly as expanding economies increase the need to move goods and people. Vehicle ownership per capita is also highly correlated with rising incomes and has much room to grow in non-OECD countries. For these reasons, non-OECD economic growth rates tend to be an important factor affecting oil prices.
China's strong economic growth has recently resulted in that country becoming the largest energy consumer and second largest oil consumer in the world. In addition, China's rising oil consumption has been a major contributor to incremental growth in worldwide oil consumption. US Energy Information Administration projects that virtually all the net increase in oil consumption in the next 25 years will come from non-OECD countries.
Although oil use is clearly tied to economic activity, energy policies also significantly affect that relationship. Many developing countries, for example, control or subsidize end-use prices, which inhibits consumer response to market price changes. This reduced demand response to price changes further contributes to the importance of economic growth as a key driver of non-OECD demand and in turn global oil prices.
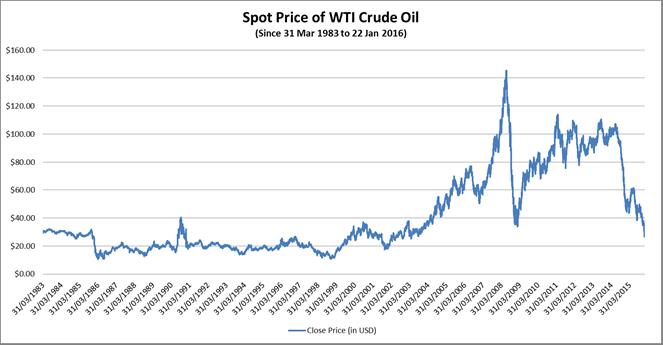
Crude oil prices
Crude oil prices measure the spot price of various barrels of crude oil, most commonly either the West Texas Intermediate (“WTI”) or the Brent Blend. The OPEC basket price and the NYMEX futures price are also sometimes quoted.
WTI crude oil is of very high quality because it is light-weight and has low sulphur content. For these reasons, it is often referred to as “light, sweet” crude oil. These properties make it excellent for making gasoline. That is why it is the major benchmark of crude oil in the Americas. Please refer to “What is WTI crude oil” below for more information on WTI crude oil.
Brent Blend is a combination of crude oil from 15 different oil fields in the North Sea. It is less “light” and “sweet” than WTI, but still excellent for making gasoline. It is refined in Northwest Europe and is the primary benchmark for other crude oil in Europe or Africa.
As crude oil is traded in a global market, prices of the many crude oil streams produced globally tend to move closely together, although there are persistent differentials between light-weight, low-sulphur (light-sweet) grades and heavier, higher-sulphur (heavy-sour) crudes that are lower in quality.
Both crude oil and petroleum product prices can be affected by events that have the potential to disrupt the flow of oil and products to market, including geopolitical and weather-related developments. These types of events may lead to actual disruptions or create uncertainty about future supply or demand, which can lead to higher volatility in prices. The volatility of oil prices is inherently tied to the low responsiveness or “inelasticity” of both supply and demand to price changes in the short run. Both oil production capacity and the equipment that use petroleum products as their main source of energy are relatively fixed in the near term. It takes years to develop new supply sources or vary production, and it is very hard for consumers to switch to other fuels or increase fuel efficiency in the near term when prices rise. Under such conditions, a large price change can be necessary to re-balance physical supply and demand following a shock to the system.
Much of the world's crude oil is located in regions that have been prone historically to political upheaval, or have had their oil production disrupted due to political events. Several major oil price shocks have occurred at the same time as supply disruptions triggered by political events, most notably the Arab Oil Embargo in 1973-74, the Iranian revolution and Iran-Iraq war in the late 1970s and early 1980s, and Persian Gulf War in 1990. More recently, disruptions to supply (or curbs on potential development of resources) from political events have been seen in Nigeria, Venezuela, Iraq, Iran and Libya.
 Given the past history of oil supply disruptions emanating from political events, market participants are always assessing the possibility of future disruptions and their potential impacts. In addition to the size and duration of a potential disruption, they also consider the availability of crude stocks and the ability of other producers to offset a potential supply loss. For example, if the market has ample spare production capacity to offset a possible disruption, its likely impact on prices would be smaller than if spare production capacity was much lower. When there are significant concerns about the potential for a disruption at a time when spare capacity and inventories are not seen as sufficient to substantially offset the associated loss in supply, prices may be above the level that might be expected if only current demand and supply were considered, as forward-looking behaviour adds a “risk premium”.
Weather can also play a significant role in oil supply. Hurricanes in 2005, for example, shut down oil and natural gas production as well as refineries. As a result, petroleum product prices increased sharply as supplies to the market dropped. Severely cold weather can strain product markets as producers attempt to supply enough of the product, such as heating oil, to consumers in a short amount of time, resulting in higher prices. Other events such as refinery outages or pipeline problems can restrict the flow of oil and products, driving up prices.
However, the influence of these types of factors on oil prices tends to be relatively short lived. Once the problem subsides and oil and product flows return to normal, prices usually return to previous levels.
Oil price and financial market
Market participants not only buy and sell physical quantities of oil, but also trade contracts for the future delivery of oil and other energy derivatives. One of the roles of futures markets is price discovery, and as such, these markets play a role in influencing oil prices.
Oil market trading activity involves a range of participants with varying motivations, even within individual participants. Some, such as oil producers and airlines, have a significant commercial exposure to changes in the price of oil and petroleum-based fuels, and may seek to hedge their risk by buying and selling energy derivatives. For example, an airline may want to buy futures or options in order to avoid the possibility that its future fuel costs will rise above a certain level, while an oil producer may want to sell futures in order to lock in a price for its future output.
Banks, hedge funds, commodity trading advisors, and other money managers who often do not have interests in trading physical oil are also active in the market for energy derivatives to try to profit from changes in prices. In recent years, investors have also shown interest in adding energy and other commodities as alternatives to equity and bond investments to diversify their portfolios or to hedge inflation risks.
Activity in commodity exchange contracts has risen in recent years. One measure of activity in futures markets is open interest on exchanges, which indicates the number of contracts in a trading session that have not been settled or closed.
Banks, hedge funds and other “non-commercial” investors can add liquidity to futures and derivative markets by taking the other side of transactions with commercial participants. On the other hand, concerns have been raised that non-commercial commodity trading and investment may amplify price movements, particularly at times when momentum is running strongly in a particular direction.
Activity in commodity exchange contracts has risen in recent years. One measure of activity in futures markets is open interest on exchanges, which indicates the number of contracts in a trading session that have not been settled or closed.
Given the past history of oil supply disruptions emanating from political events, market participants are always assessing the possibility of future disruptions and their potential impacts. In addition to the size and duration of a potential disruption, they also consider the availability of crude stocks and the ability of other producers to offset a potential supply loss. For example, if the market has ample spare production capacity to offset a possible disruption, its likely impact on prices would be smaller than if spare production capacity was much lower. When there are significant concerns about the potential for a disruption at a time when spare capacity and inventories are not seen as sufficient to substantially offset the associated loss in supply, prices may be above the level that might be expected if only current demand and supply were considered, as forward-looking behaviour adds a “risk premium”.
Weather can also play a significant role in oil supply. Hurricanes in 2005, for example, shut down oil and natural gas production as well as refineries. As a result, petroleum product prices increased sharply as supplies to the market dropped. Severely cold weather can strain product markets as producers attempt to supply enough of the product, such as heating oil, to consumers in a short amount of time, resulting in higher prices. Other events such as refinery outages or pipeline problems can restrict the flow of oil and products, driving up prices.
However, the influence of these types of factors on oil prices tends to be relatively short lived. Once the problem subsides and oil and product flows return to normal, prices usually return to previous levels.
Oil price and financial market
Market participants not only buy and sell physical quantities of oil, but also trade contracts for the future delivery of oil and other energy derivatives. One of the roles of futures markets is price discovery, and as such, these markets play a role in influencing oil prices.
Oil market trading activity involves a range of participants with varying motivations, even within individual participants. Some, such as oil producers and airlines, have a significant commercial exposure to changes in the price of oil and petroleum-based fuels, and may seek to hedge their risk by buying and selling energy derivatives. For example, an airline may want to buy futures or options in order to avoid the possibility that its future fuel costs will rise above a certain level, while an oil producer may want to sell futures in order to lock in a price for its future output.
Banks, hedge funds, commodity trading advisors, and other money managers who often do not have interests in trading physical oil are also active in the market for energy derivatives to try to profit from changes in prices. In recent years, investors have also shown interest in adding energy and other commodities as alternatives to equity and bond investments to diversify their portfolios or to hedge inflation risks.
Activity in commodity exchange contracts has risen in recent years. One measure of activity in futures markets is open interest on exchanges, which indicates the number of contracts in a trading session that have not been settled or closed.
Banks, hedge funds and other “non-commercial” investors can add liquidity to futures and derivative markets by taking the other side of transactions with commercial participants. On the other hand, concerns have been raised that non-commercial commodity trading and investment may amplify price movements, particularly at times when momentum is running strongly in a particular direction.
Activity in commodity exchange contracts has risen in recent years. One measure of activity in futures markets is open interest on exchanges, which indicates the number of contracts in a trading session that have not been settled or closed.
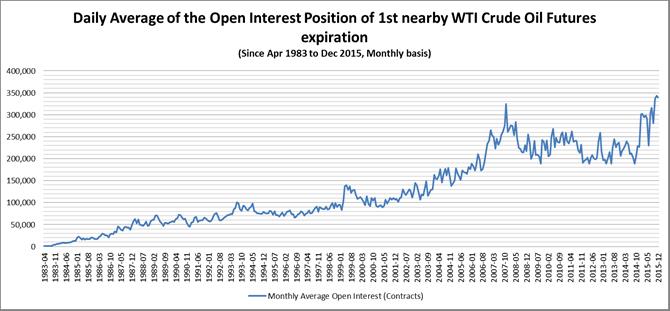 Open interest on exchange-traded crude oil futures contracts increased substantially over the past decade, as measured by the NYMEX, the main commodities exchange for energy products in the United States.
Both commercial participants with “real” demand for oil and non-commercial investors, such as money managers and funds that are interested in trading contracts for investment and diversification purposes, have shown increased trading activity.
In addition to Futures Contracts, another way for market participants to invest in crude oil is through the buying and selling of options contracts. Options allow for investment exposure with limited potential for losses and provide an insurance-like instrument against adverse commodity price movements.
Open interest on exchange-traded crude oil futures contracts increased substantially over the past decade, as measured by the NYMEX, the main commodities exchange for energy products in the United States.
Both commercial participants with “real” demand for oil and non-commercial investors, such as money managers and funds that are interested in trading contracts for investment and diversification purposes, have shown increased trading activity.
In addition to Futures Contracts, another way for market participants to invest in crude oil is through the buying and selling of options contracts. Options allow for investment exposure with limited potential for losses and provide an insurance-like instrument against adverse commodity price movements.
|
| |
Disclaimer:
- Certain information contained in this website is compiled from third party sources. Mirae Asset Global Investments (Hong Kong) Limited (“Mirae Asset HK”) has used its best endeavor to ensure that such information is accurate, complete and up-to-date, and has taken care in accurately reproducing the information. Mirae Asset HK accepts no liability for any loss or damage of any kind resulting out of the unauthorized use of this website. The information contained in this website is for information purposes only and does not constitute any recommendation, offer or solicitation to buy, sell or subscribe to any securities or financial instruments in any jurisdiction. Investment involves risk. It cannot be guaranteed that the performance of the Fund will generate a return and there may be circumstances where no return is generated or the amount invested is lost. Past performance is not indicative of future performance. Before making any investment decision to invest in the Fund, investors should read the Fund’s prospectus for details and the risk factors. Investors should ensure they fully understand the risks associated with the Fund and should also consider their own investment objective and risk tolerance level. Investors are advised to seek independent professional advice before making any investments. The Fund’s prospectus is available on this website.
- References to particular sectors, securities or companies are for general information and illustrative purposes only and are not recommendations to buy or sell a security, or an indication of the issuer's holdings at any one time.
- The funds or securities referred to herein are not sponsored, endorsed, or promoted by Standard & Poor's (”S&P”), and S&P bears no liability with respect to any such funds or securities or any index on which such funds or securities are based. The Fund’s prospectus contains a more detailed description of the limited relationship S&P has with Mirae Asset HK and any related funds.
- Investors should note that the Fund differs from a typical retail fund as units of the Fund may only be created and realized by participating dealers in large unit sizes. This website is prepared and maintained by Mirae Asset HK and has not been reviewed by the Securities and Futures Commission of Hong Kong.